‘The War Census of 1915: Honest History highlights reel (Part II)’, Honest History, 4 August 2015
War worries are added to by the census, which probes into the pockets and the soul of every citizen, asking him in plain print under compulsion why he cannot go to the war and what money he has got. These are necessary measures for the time being however, and justice should come out of them in the form of more equitable recruiting and a fair if heavy tax. The census does not mean conscription, but it paves the way for it to follow if necessary. (Table Talk, Melbourne, 22 July 2015)
‘What money he has got.’ The War Census of 1915 actually came at this question in two ways, by asking not only about ‘net income’ but also about ‘net assets’. There is a lot more in GH Knibbs’ report The Private Wealth of Australia and its Growth (see Part I of our highlights reel) than we will cover here – and a number of caveats as well – but here are some of Knibbs’ findings, with all figures in pounds (£), rounded, for the year ended 30 June 2015.
Net income
The War Census estimated net income for the Commonwealth (residents and non-residents) at £257.7 million, though this figure was derived from census returns (called ‘cards’ because they came in on cards) from only 44.2 per cent of the population of five million. The aggregate net income for residents was £240.2 million, from which the War Census derived an average annual net income for residents ‘per head of population’ of £48 9s. 7d. It also calculated an average annual net income ‘per card’ (that is, per those who responded) of £110, which, given the relatively low rate of returns, made much more sense than per head of population.
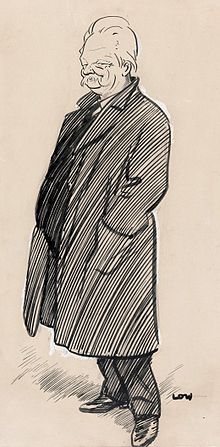 GH Knibbs by David Low, 1919 (Wikipedia)
On the other hand, the War Census’s average annual net income ‘per card’ for resident men of £146 (or £2 16.s 0d a week) was spot on with Knibbs’ figure for average male weekly earnings at end 1914 of £2 15s. 7d a week). The War Census was further out for resident women at £48 annually (18s. 4d. a week) for adult women, which compared with adult females in the average weekly wage survey at £1 7s. 5d. a week.
More interesting are the variations in income – and a survey sample of 44.2 per cent on this question is pretty good, particularly with the assurance of the check against the weekly wage survey. The War Census found around 17.5 per cent of returns showed net annual incomes of £156 or above. This 17.5 per cent accounted for about 52 per cent of the net income. Put simply, about one-sixth of the Australian population in 1915 earned about half of the net income. (The census also broke the returns down into states and male and female income earners.)
Net assets
The War Census returns showed that the aggregate private wealth (measured by assets) of Australian residents was around £1470 million, or around £300 per head of population. Again, note that returns (cards) came in from less than half of the population, male and female, so the per head of population calculation seems fairly meaningless. The War Census then presented a smaller figure of £1216.3 million for individuals resident in Australia – this figure seems to have been derived by subtracting the assets of companies. It translated to average net assets of £246 per head of population (again, a puzzling calculation).
More plausibly, the War Census concluded, for Australian residents, that around one-sixth of the returns (about 17.5 per cent) accounted for around five-sixths (87.5 per cent) of total net assets. So one-sixth of Australians owned five-sixths of the wealth, measured in assets. But the most illuminating of Knibbs’ tables presents percentages against value of assets. (As with income, this survey of some 2.2 million Australians is likely to be a reasonably accurate representation of the overall position.) Of those surveyed, 16.4 per cent had no wealth (assets) or were in debt, 42.2 per cent had wealth of less than £100, and 31.4 per cent had wealth of between £100 and £1000. So, 90 per cent of Australians in 1915 had wealth of less than £1000. Another six per cent held wealth of between £1000 and £2500 while, at the very top, 466 individuals (0.02 per cent of the population) had wealth exceeding £100 000.
Stilwell and Jordan’s view
As noted above, there is much more in Knibbs’ numbers, although large parts of the book, where he discusses the attributes of different methods, are probably only of interest to statisticians, and perhaps antiquarian statisticians at that. Nevertheless, the War Census has been of intermittent interest to other students in the century since it was done. There was, for example, an article by Lee Soltow in Australian Economic History Review in 1972.
More recently, Frank Stilwell and Kirrily Jordan, writing in 2002, summarised Knibbs’ main points and pointed out that, while Australia in 1915 was relatively wealthy compared with other countries then, its wealth was far less in relative terms than in the early 21st century. The authors found that the average household wealth in 1915 of £558 was roughly the equivalent of $35 000 in 2002 or less than ten per cent of average household wealth in that year ($404 300).
Egalitarianism?
For a country which had developed a reputation as a social laboratory and pioneer of egalitarian reform the War Census threw up some interesting conclusions.
The wealth that did exist was markedly concentrated [conclude Stilwell and Jordan]. The elite of Australian society had a dominating social and political influence in 1915, even though its wealth in purely economic terms was relatively modest. The wealth of the 466 richest people in 1915 was equivalent in value to $5612 million at the end of the twentieth century. In that latter year [2000] the 500 wealthiest people had total assets amounting to $57 090 million. So, in terms of broad aggregates, the wealth of the elite had multiplied about tenfold during the century. Even more startling is the observation that Australia’s richest person today is wealthier than all 466 richest people combined in 1915, even allowing for the general inflation that has occurred in the interim. (p. 62)
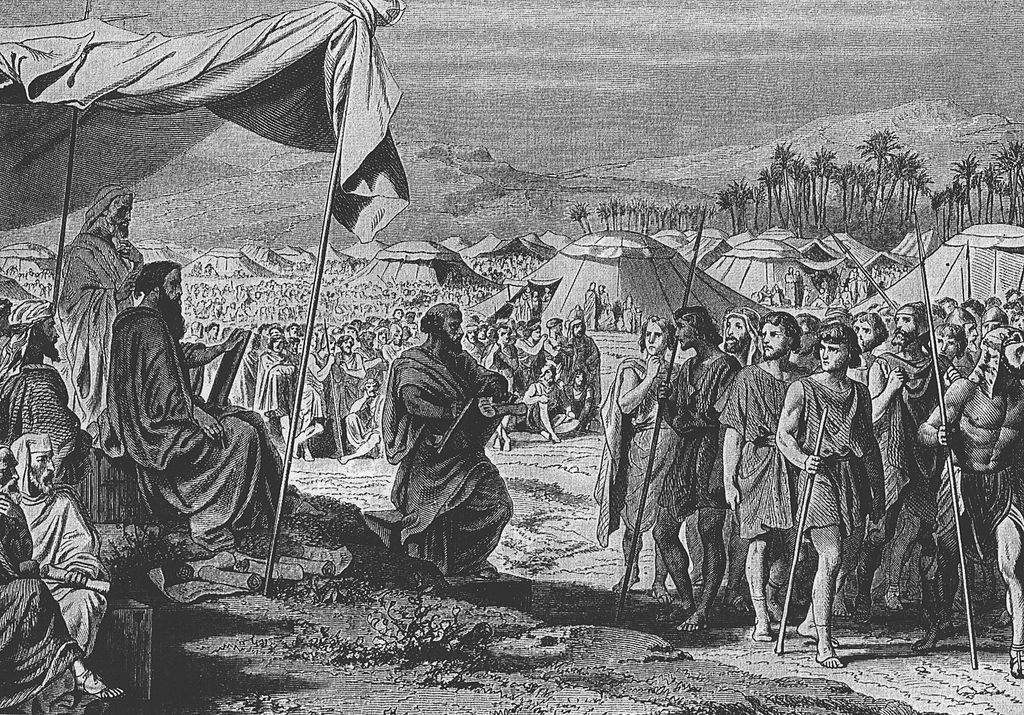 The Numbering of the Israelites, as in Numbers 1, engraving by Henri Félix Emmanuel Philippoteaux , (1815–84) (Wikimedia Commons/Dauster)
However, while 1915 Australia was less of a ‘working man’s paradise’ than we may have thought, it was egalitarian compared with the rest of the world. Piketty estimates that, immediately before the Great War, income inequality in Australia (and New Zealand) was less than in Europe, the United States and Canada.
[T]he top centile’s [that is, the top one per cent] share of national income exceeded 20 percent in all the countries of Europe in 1900–1910 … It is interesting to note that, compared with Europe, inequality was lower not only in the United States and Canada (where the top centile’s share of national income was roughly 16–18 percent at the beginning of the twentieth century) but especially in Australia and New Zealand (11–12 percent). Thus it was the New World, and especially the newest and most recently settled parts of the New World, that appear to have been less inegalitarian than Old Europe in the Belle Époque. (Thomas Piketty, Capital in the Twenty-First Century, Harvard University Press, Cambridge MA, 2014, Kindle Edition, p. 322)
For a collection of resources on inequality and its history, particularly in Australia, try this. For more on the War Census and on the history of Australian statistics generally, see this article by Forster and Hazlehurst, originally written in 1988 but updated in 2009. Of the War Census, Forster and Hazlehurst concluded ‘the inquiry was a uniquely revealing exercise which, as the 1925 Year Book candidly admitted, was unlikely to be repeated in “normal” times because of its “inquisitorial character”’.
Next time we will present some highlights of a couple of articles which looked at trends in income (not wealth) in Australia during the 20th century. We hope to look also at modern comparisons between Australia and the rest of the world.